Updated February 2026
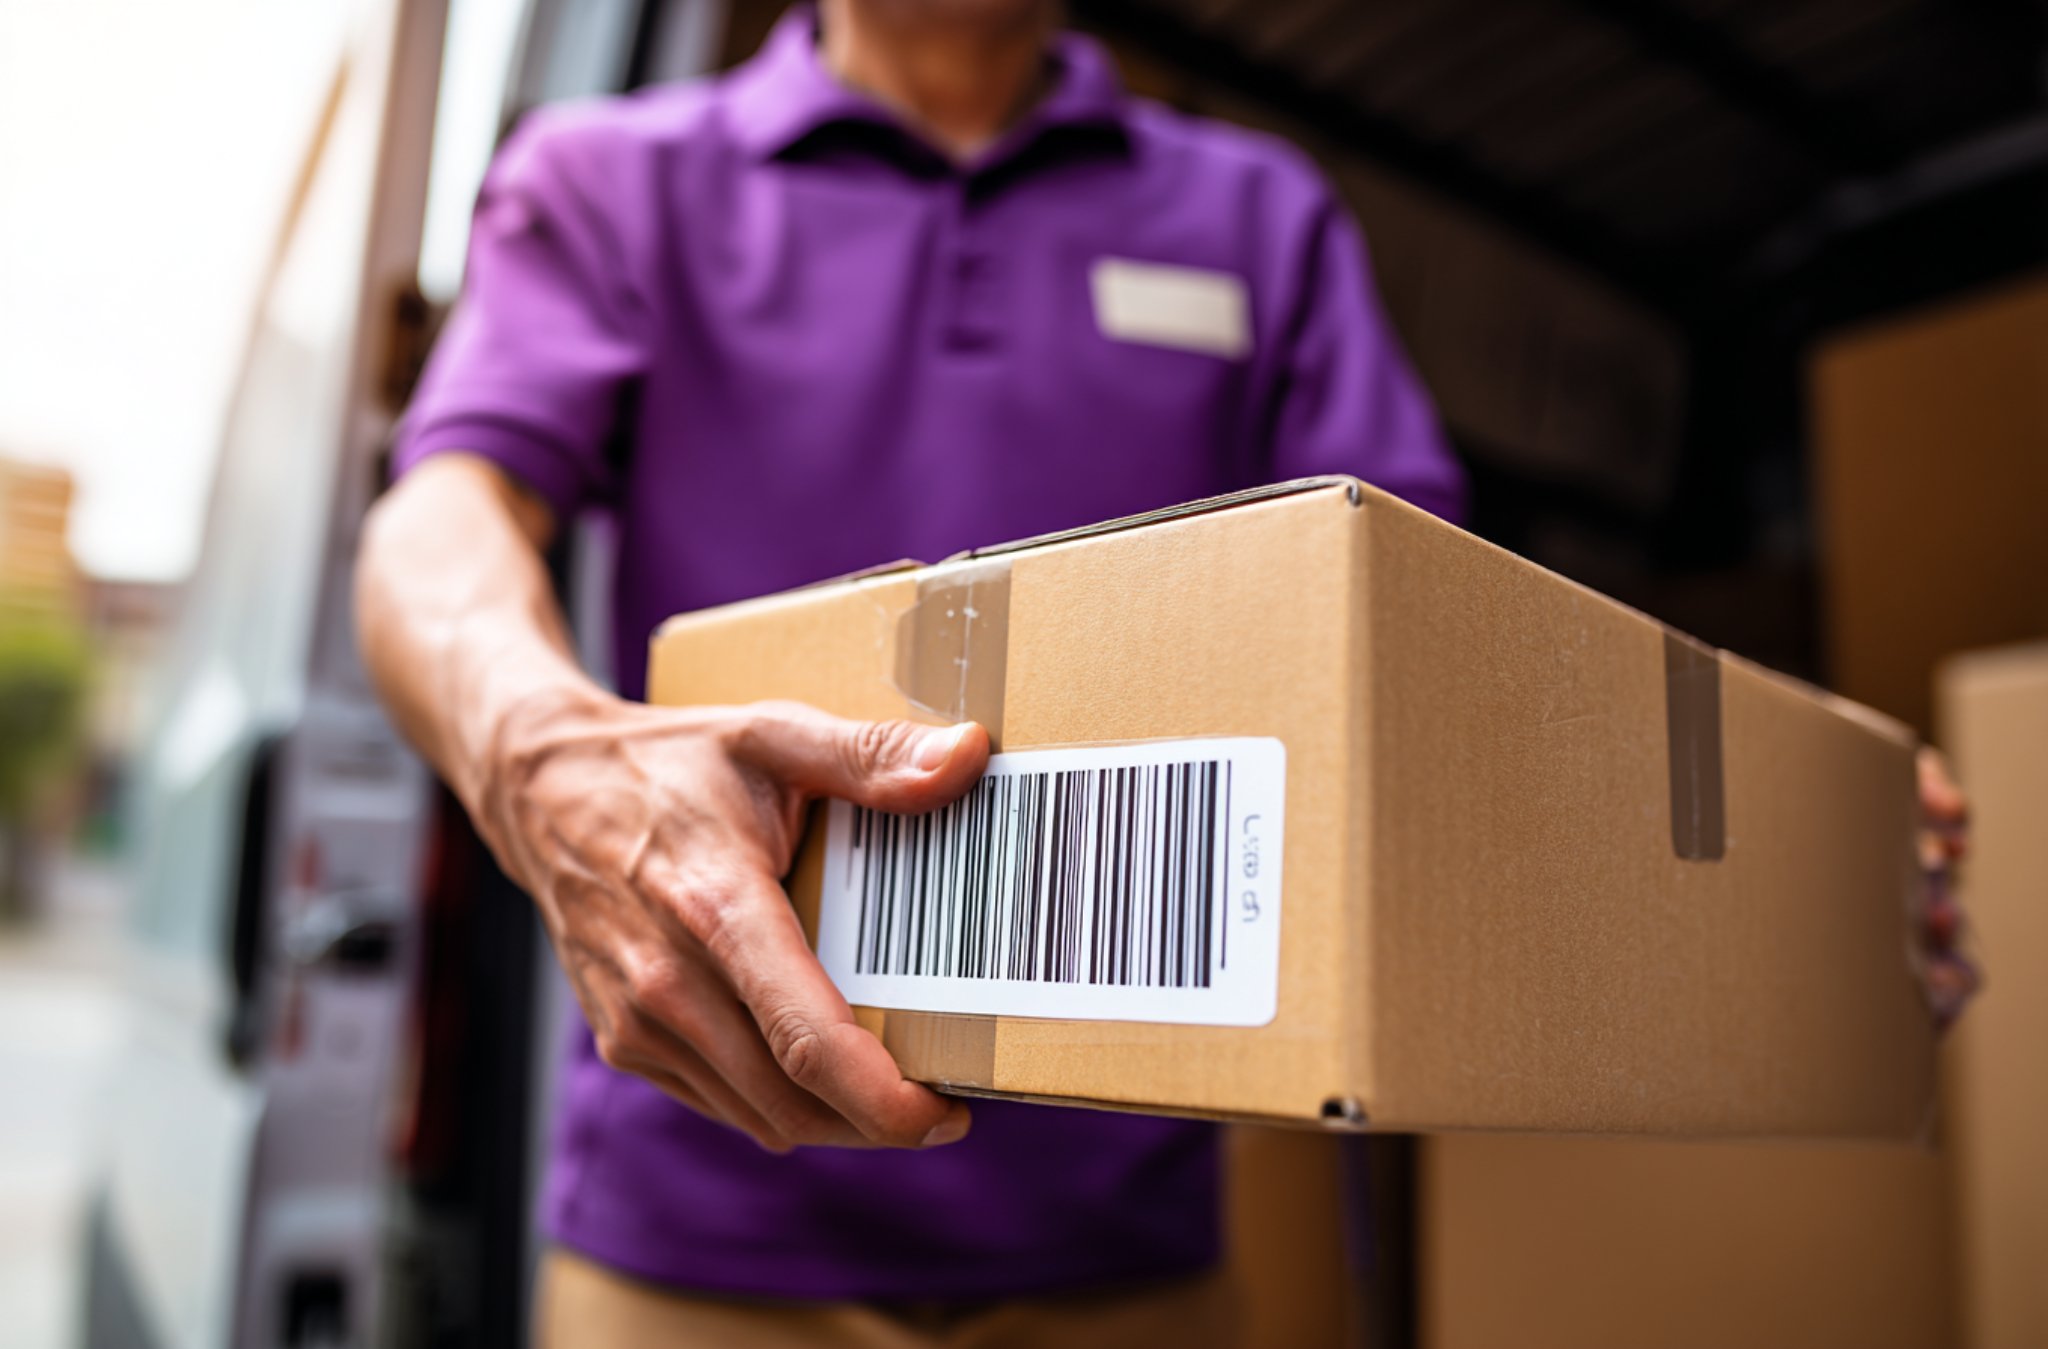
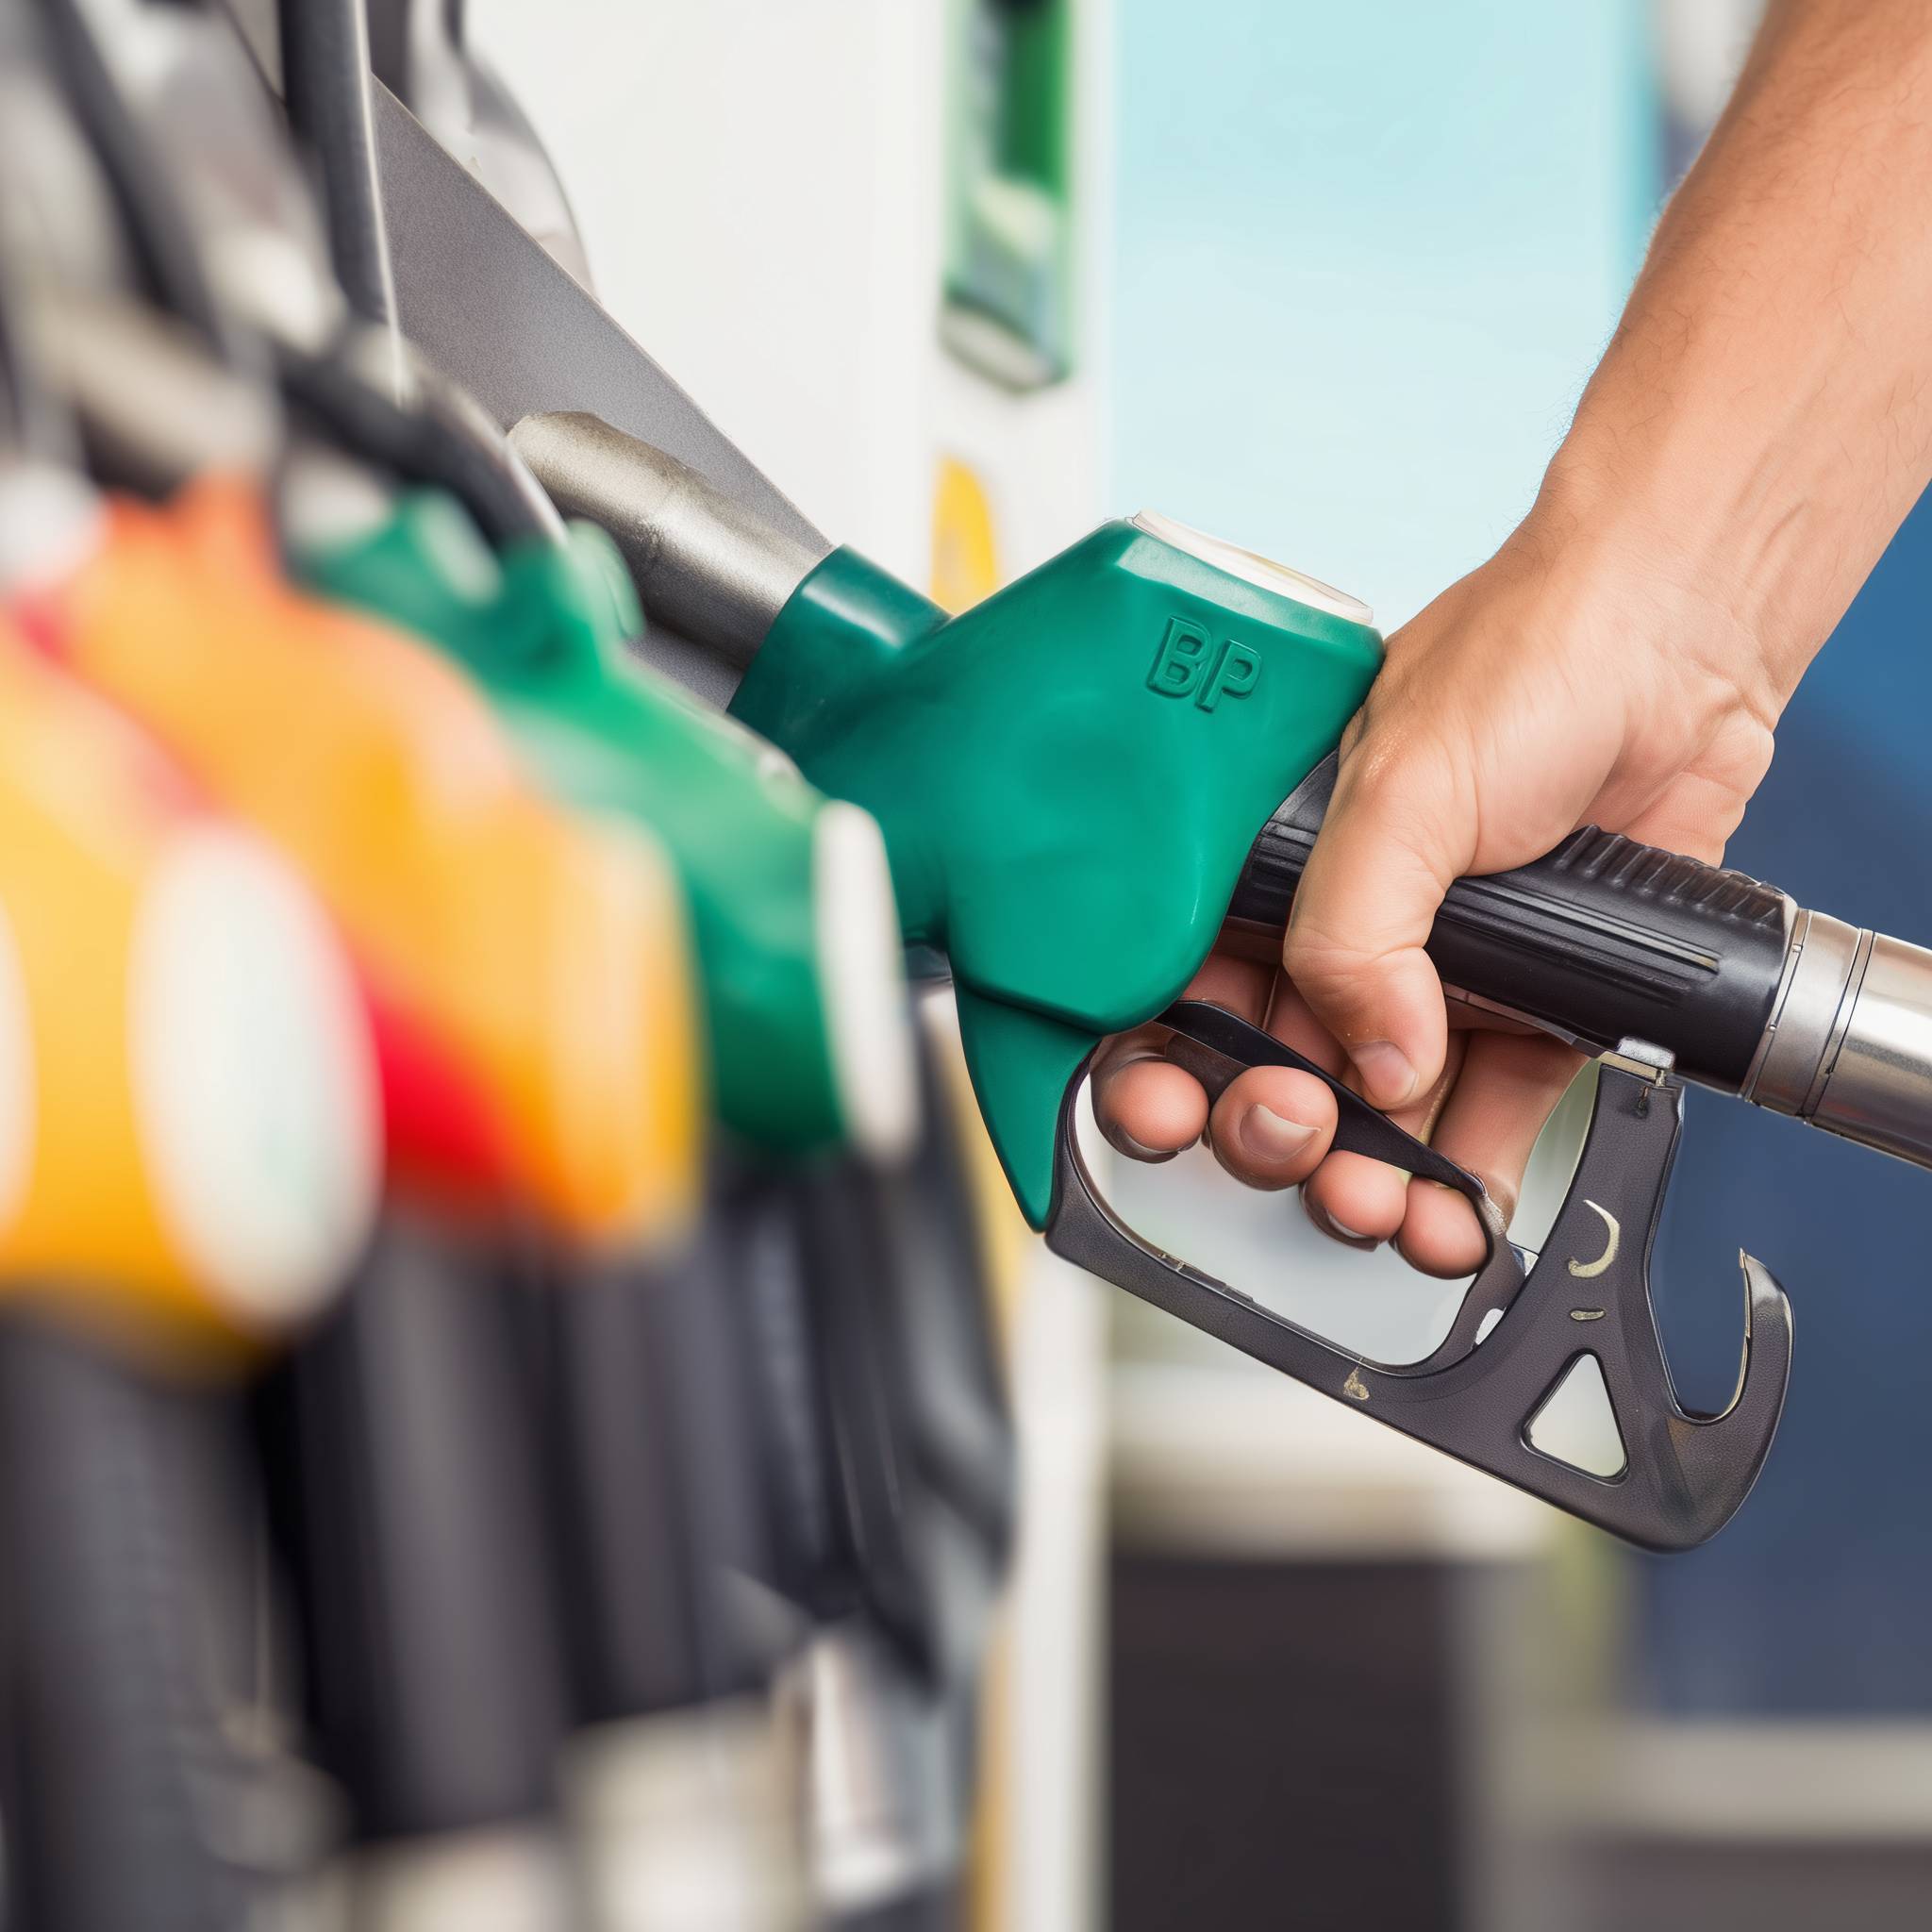
Fuel is one of the most important — and often least understood — cost drivers in last-mile delivery. Many courier services and e-commerce delivery teams track total fuel spend, but far fewer measure fuel cost per delivery, which is the metric that actually tells you whether your routes are becoming more efficient or more expensive over time.
With fuel prices fluctuating and delivery density changing by season, measuring fuel cost per delivery gives operators a clear baseline to evaluate route optimization, delivery volume changes, and the impact of tools like AI routing. Industry operations research highlights fuel efficiency and distance traveled as key levers in last-mile delivery performance (International Energy Agency, 2024).
What Is Fuel Cost per Delivery?
Fuel cost per delivery measures how much fuel spend is allocated to each completed delivery stop. It answers a simple question:
How much does it cost in fuel to deliver one package?
This metric is more actionable than total fuel cost because it accounts for route density, delivery volume, and operational efficiency.
Basic formula:
Example: Calculating Fuel Cost per Delivery (Simple Scenario)
Let’s say a courier completes 80 deliveries in one day and spends $120 on fuel.
That $1.50 becomes your baseline. As you optimize routes, increase stop density, or reduce redeliveries, this number should go down.
What Impacts Fuel Cost per Delivery?
Several operational factors influence fuel cost per stop:
- Total kilometers driven (longer routes = higher fuel use)
- Stop density (more deliveries per route lowers cost per stop)
- Traffic and idling (wasted fuel during congestion)
- Vehicle type and efficiency
- Failed delivery attempts (repeat trips increase fuel cost per delivery)
Transportation research consistently shows that distance traveled and stop sequencing are primary drivers of fuel use in urban delivery systems (ScienceDirect – route choice and fuel consumption).
A More Detailed Example (Realistic Route)
This kind of breakdown helps operations teams understand how distance, fuel efficiency, and stop count combine to shape real costs.
How to Track Fuel Cost per Delivery Over Time
To make this metric useful, track it per route, per driver, and per region:
- Daily average fuel cost per stop
- Weekly trend by delivery zone
- Peak vs. off-peak performance
- Before vs. after route optimization changes
Fleet management best practices recommend monitoring fuel cost per mile or per stop as a performance KPI to identify inefficiencies early (Geotab, 2024).
How AI and Route Optimization Improve Fuel Cost per Delivery
Smarter routing reduces total distance driven and idle time. Industry research and applied fleet studies show that route optimization and telematics can significantly reduce fuel consumption by cutting unnecessary mileage and congestion exposure (HERE Technologies, 2024).
For last-mile delivery, this translates directly into lower fuel cost per stop.
How Koorier Helps Reduce Fuel Cost per Delivery
Koorier helps courier services and delivery teams reduce fuel cost per delivery through:
- Route optimization that minimizes total distance
- Real-time re-routing to avoid traffic delays
- Better stop sequencing to increase delivery density
- Fewer failed delivery attempts through predictive ETAs
- Local delivery with a 100% electric vehicle fleet for zero fuel consumption on EV routes
This combination improves both operational efficiency and sustainability while keeping delivery speed competitive.
Common Mistakes When Measuring Fuel Cost per Delivery
- Only tracking total fuel spend (not cost per stop)
- Ignoring redeliveries in the delivery count
- Not separating urban vs. suburban routes
- Comparing routes with very different densities
- Failing to update baselines after operational changes
Author & Authority
By Giovanna Freitas
Marketing specialist at Koorier
About Koorier
Koorier is a Canadian logistics technology company specializing in regional last-mile delivery networks and real-time delivery visibility for retailers and enterprises.
Turn Fuel Cost Per Delivery Into a Competitive Advantage
Once you know your fuel cost per delivery, you can actively reduce it through smarter routing, better delivery density, and fewer failed attempts. This turns fuel from an unpredictable cost into a controllable performance metric.
Request a shipping quote and learn how Koorier helps reduce fuel cost per delivery.
FAQs: Fuel Cost per Delivery
What is fuel cost per delivery?
It’s the average fuel expense allocated to each completed delivery stop.
How often should I calculate fuel cost per delivery?
At least weekly, and ideally per route or delivery zone for meaningful insights.
Is fuel cost per delivery relevant for electric vehicles?
Yes. While EVs don’t use fuel, measuring energy cost per delivery follows the same logic and helps manage charging and route efficiency.
What’s a good benchmark for fuel cost per delivery?
Benchmarks vary widely by density, city, and vehicle type. The most useful benchmark is your own baseline over time.
Can route optimization lower fuel cost per delivery?
Yes. Reducing total distance and increasing stop density directly lowers fuel cost per delivery.


.png)